When the market is up, people start to worry about valuations…
And one of the most popular valuation metrics is the price-to-earnings (P/E) ratio.
The calculation is simple. Divide the price of a stock by its earnings per share.
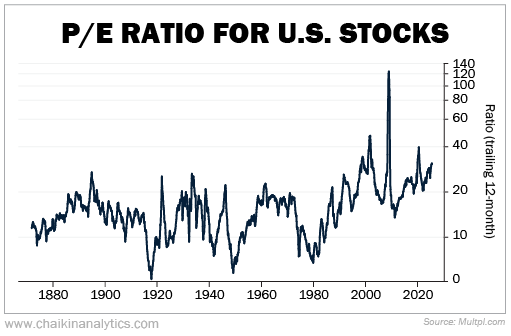
Right now, the S&P 500 Index trades at a trailing 12-month P/E ratio of more than 30 times. Historically, that’s high. But as we’ll explain, this one metric doesn’t tell the full story…
Here’s what the P/E ratio for U.S. stocks looks like on a longer-term basis…
 “Bears” often cite high P/E ratios as a reason for caution…
Federal Reserve Chair Jerome Powell recently got on this bandwagon. Back in September, he sent the market tumbling by noting in a speech that “equity prices are fairly highly valued.”
But it’s not so cut-and-dried on how important the P/E ratio is…
I talked with my colleague and Chaikin Analytics founder Marc Chaikin for his take on the importance of the P/E ratio – particularly its role in determining Power Gauge ratings.
At Chaikin Analytics, we use the Power Gauge to analyze the markets. This key tool gathers investment fundamentals and technicals into a simple rating of “bullish,” “neutral,” or “bearish.”
Marc said that in the 1980s and 1990s, P/E ratios were highly relevant in identifying attractive stocks. Price-to-sales (P/S) ratios later took priority… then yielded to earnings growth and momentum.
Today, the Power Gauge uses the projected P/E ratio within the Earnings category, which is just one of the categories it looks at to determine a stock’s rating. And it ranks that ratio on a relative basis versus other stocks.
If the projected P/E ratio drifts upward, that isn’t automatically a bad sign. What matters is how the ratio ranks versus other stocks – not the absolute number.
Of course, people love to talk about P/E ratios. And they usually infer that a high P/E ratio is bad… and that a low P/E ratio is good.
But that doesn’t always hold true in practice. Let’s look at a couple of examples…
Two Vastly Different Moves Following ‘Low’ and ‘High’ P/E Ratios
First is athletic apparel company Lululemon Athletica (LULU)…
As a brand, Lululemon is a massive success.
The company’s clothes are everywhere. And folks love them…
When asked whether they considered themselves loyal customers, 83% of Lululemon’s customers said “yes.”
And 8 out of every 10 Lululemon customers join the company’s membership program. As of 2024, that program had 22 million members.
To an investor, that looks like a formidable competitive moat.
And going into 2024, Lululemon’s stock looked attractive based on its historical P/E range…
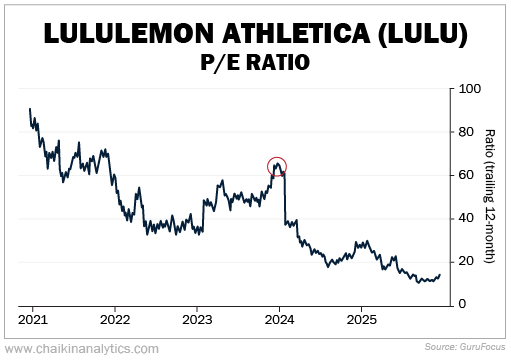 As you can see, its P/E ratio had dropped from almost 90 times to around 64 times. Investors might have thought they were getting a bargain.
But consider how Lululemon’s stock ended up performing…
It fell by about 25% in 2024. And it ended 2025 down roughly 46%.
As it turns out, Lululemon’s products had become stale and predictable – particularly in its core U.S. market, where sales were declining.
And buying the stock just because its P/E ratio looked cheap would’ve lost you a lot of money.
A different example is Big Pharma firm Eli Lilly (LLY)…
Lilly’s drugs Zepbound and Mounjaro generated $10.1 billion in the third quarter of 2025 alone. This made tirzepatide – which is behind both Zepbound and Mounjaro – the world’s bestselling drug. Lilly now controls about 58% of the obesity drug market.
But Lilly looked expensive in January 2024. Its P/E ratio had more than tripled – from less than 30 times to more than 100 times. A skeptic would’ve said you were paying way too much for the stock.
Take a look at this chart…
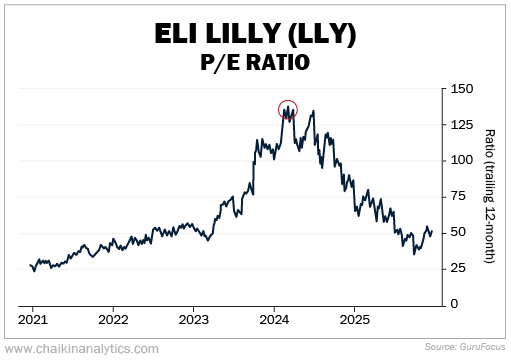 Since then, Lilly has soared. The stock jumped by about 32% in 2024. And it closed out 2025 up roughly 40%.
These examples reveal something important…
There’s More to a Good Investment Than the P/E Ratio
A low P/E ratio doesn’t guarantee a good investment. And a high P/E ratio doesn’t mean you should automatically avoid a stock.
Business quality and growth potential matter more than one simple valuation metric.
Plus, some stocks are cyclical – think automakers, homebuilders, and industrial companies.
Cyclical stocks flip that “low P/E ratio” versus “high P/E ratio” logic on its head…
They’ll often look cheapest (with a low P/E ratio) at the worst possible time to buy. That’s usually right before earnings collapse.
And the opposite is also true…
Cyclical stocks often look most expensive (with a high P/E ratio) at the best time to buy. That’s when earnings have hit bottom and are about to rebound.
True, the S&P 500’s valuation of more than 30 times trailing 12-month earnings is high. But again, P/E ratios alone don’t determine investment success.
A stock with a low P/E ratio can still be a terrible investment if the business is deteriorating. Meanwhile, a high P/E ratio can be a powerful signal of a company’s growth prospects.
So when people worry about the market’s high P/E ratio, remember that the number itself doesn’t tell the whole story.
In investing, what really matters is finding quality businesses with strong fundamentals and growth potential.
Good investing,
Joe Austin
He issued warnings for RNG before it crashed 89%, BYND before it crashed 90%, TDOC before it crashed 84%, and FVRR before it crashed 86%. Now, he's stepping forward to name the popular stock that could go down as one of the worst-performing tickers of the year. It could be the most dangerous stock of 2026. Click here for its name and ticker, 100% free.
Source: Daily Wealth