Why the 20% Rally Might Be Just Another Bear Market Trap
The S&P 500 is almost 20% higher than its April 9 lows allowing some investors to proclaim the end of the bear market, they could be painfully wrong.
Bear market rallies are some of the most dangerous moves in the market.
They masquerade as recoveries, lure investors back in, and then pull the rug out – often making new lows in the process. They’re not just countertrend bounces. They’re psychological traps that exploit every instinct to “buy the dip” at precisely the wrong moment.
And we’re watching that exact setup play out again.
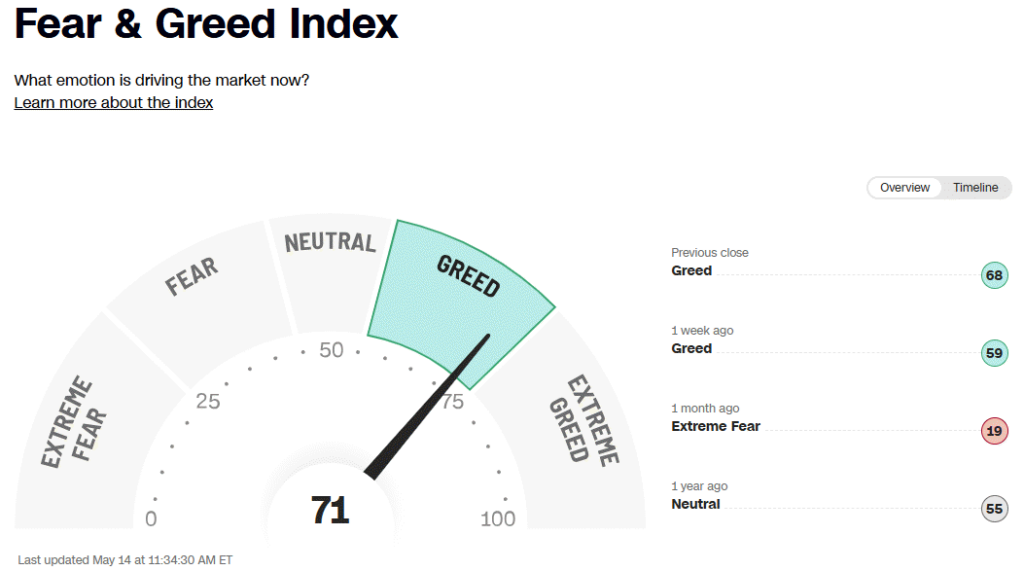
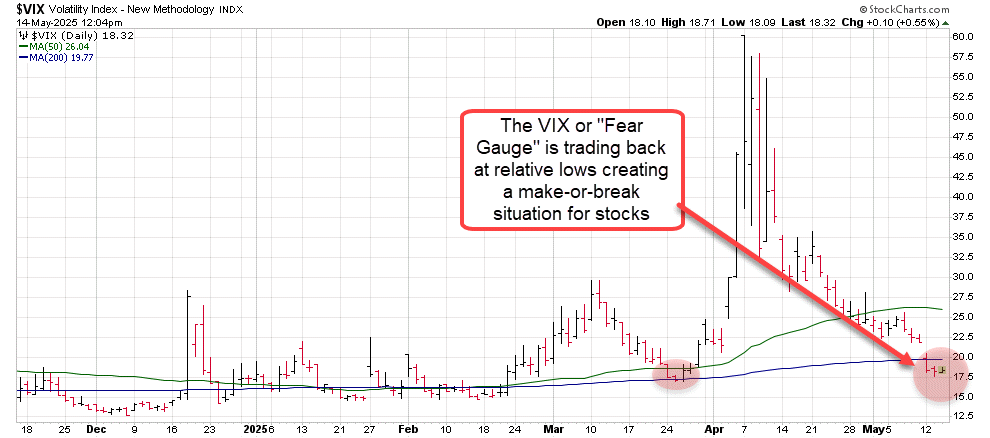
The CNN Fear & Greed Index has swung violently in the last month. The index is a good read on investor sentiment- from “Extreme Fear” in April to nearly “Extreme Greed” in less than a month. The VIX has collapsed, reflecting widespread complacency. Traders are bidding up high-beta stocks, dismissing recession risk, and assuming the Fed will rescue the market with rate cuts later this year.
 But that’s exactly how bear market rallies behave. They don’t just climb small walls of worry – they slide down huge slopes of hope.
What Makes Bear Market Rallies So Misleading?
During prolonged bear markets, sharp rallies are common. In fact, many of the largest percentage gains in stock market history happened inside bear markets, not during bull runs. That’s because oversold conditions and panic selling create the technical fuel for explosive rebounds.
The key distinction? In a true bull market, rallies break through long-term resistance and hold. In a bear market, they fail to reclaim key technical levels—like the 200-day moving average—and roll over.
Bear market rallies typically:
- Recover 20% to 25% of prior losses (often retracing a Fibonacci 50% level)
- Fail to reclaim the 200-day or 20-month moving averages
- Peak on lighter volume
- Coincide with a temporary macro catalyst (rate cuts, stimulus, headline relief)
- End with a swift reversal that takes out the prior lows
That playbook has happened before, specifically in the dot-com bust. And it’s eerily similar to today.
The 2000–2002 Bear Market: A Case Study in Bull Traps
From March 2000 to October 2002, the S&P 500 dropped nearly 49%. But it didn’t fall in a straight line. It staged two powerful rallies of over 20%—each one convincing investors that the bottom was in.
The first came after 9/11. Between September 2001 and January 2002, the S&P surged 21% as the Fed slashed rates and fiscal stimulus poured into the economy. It looked like the worst was over. But that rally stalled well below the 200-day moving average and reversed sharply by February. Within months, stocks made new lows.
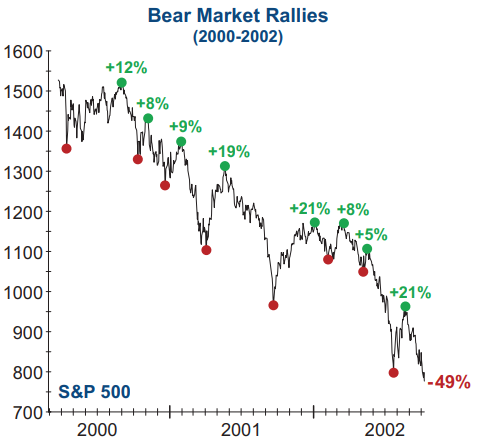 The second rally occurred in the summer of 2002. After WorldCom’s collapse and a wave of corporate scandals, the market hit fresh lows in July—then exploded 21% higher into August. Investors cheered the Sarbanes-Oxley reforms and a brief rebound in earnings. But once again, the rally failed to break long-term trend resistance. By October, the S&P was back at new bear market lows.
It wasn’t until October 2002, after 2.5 years of lower highs and relentless selling, that the market finally bottomed. That rally looked different—it broke trendlines, cleared the 200-day, and ultimately reclaimed the 20-month moving average in 2003.
The lesson? In a bear market, you can’t place blind trust in a 20% rally—not unless it breaks through the major resistance zones and holds them. We haven’t seen that yet.
This Rally Still Has All the Traits of a Trap
Let’s look at where we are right now.
The S&P 500 and Nasdaq 100 have rebounded sharply – nearly 20% and 22% off their April lows – respectively.
On paper, that looks like a new bull market. But here’s the problem: it’s happened in less than a month.
If this really marked the end of the 2025 bear market, it would make it one of the shortest on record, even shorter than the COVID-19 crash in 2020. That’s statistically unlikely.
Bear markets driven by macro stress – like trade wars, inflation, or recessions – don’t resolve in four weeks.
Meanwhile, the list of risks is still long:
- Microsoft just announced 3,000 job cuts, signaling that corporate belt-tightening is far from over.
- The U.S.–China trade war is still unresolved, with tariffs and tech restrictions escalating. This week’s pause puts the situation on the back burner for investors, but still unresolved.
- Recession indicators remain elevated, from inverted yield curves to declining leading economic indicators.
All this is happening while the VIX is near cycle lows, and sentiment is flashing greed. Retail investors are piling back into speculative names, just as they did in late 2001 and mid-2002. The emotional swing has been too fast, too euphoric, and too untethered from fundamentals.
 Technically, this rally hasn’t cleared its biggest test yet. The S&P is flirting with its 200-day moving average—but has yet to decisively reclaim it. The 20-month moving average, a critical long-term trend gauge, is still overhead. If the index stalls at either level and rolls over, it will look exactly like the failed rallies of the early 2000s.
What to Watch Next
So how do you tell the difference between a real bottom and a bull trap?
Here’s what I’m watching:
- Can the rally break above the 200-day and hold it? Watch for a move back below the Nasdaq 100’s 200-day to signal another round of selling.
- Is breadth improving? Look at advance/decline lines and whether lagging sectors like financials and industrials are joining the rally.
- Is the macro narrative improving in a durable way, or just sentiment?
- Do higher lows form on the next pullback? That would indicate a bullish trend shift, not just a bounce.
Until we see those signals, it’s safer to assume we’re still in a bear market rally.
Because in every major bear cycle the biggest losses came after the strongest rallies. And right now, this market feels more like a setup than a solution.
— Chris Johnson
The old way of investing in tech giants is over. A NEW strategy unlocks 146X more income on the SAME underlying stocks (like Meta, Apple, and Amazon) -- WITHOUT options trading. Click here to uncover the NEW MAG-7 alternative.
Source: Money Morning